A look into my life.

Monday, April 23, 2012

Intel Thinking Tools

ABOUT THE TOOLS:
Intel® Education thinking tools are based on research that demonstrates the value of visual representation in constructing and retaining new information.  There are three types of tools; Visual Ranking Tool, Seeing Reason Tool, & Showing Evidence Tool.
  • The Visual Ranking Tool helps students use their higher-order thinking skills to create and compare ordered lists.  Students identify and refine criteria as they assign order to a list and they must explain their reasoning, using a visual diagram.

  • The Seeing Reason Toolallows students to use higher-order thinking skills to analyze cause and effect.   Students create visual maps of the factors in a cause-and-effect investigation.  The maps created make thinking visible.

  • The Showing Evidence Tool has students use higher-order thinking skills when they learn to critically construct, evaluate, and defend their arguments.  Students learn how to construct good arguments and prove their case with credible evidence using visual framework to: make claims, identify evidence, evaluate the quality of that evidence, explain how the evidence supports or weakens claims, and reach conclusions based on the evidence.
 
SET UP ACCOUNT:
This picture shows what  it looks like when you are signed into an educator account.


DESCRIBE PROJECT:
When it comes to most math classes, students always ask the question,” Why do I need to know this?”  I decided to make up a project that will help explain the importance of math.  The plan is to help students analyze the processes used in making important decisions and how significant decisions affect the future. After exploring and collecting data on the benefits of math classes, students reevaluate their own choices for math classes.

Students will use the Seeing Reason Tool to create a map that represents this investigation and answer questions that require data that shows the effects of taking math courses.  This plan would have to range over a week or so incorporating: correlations, graphing, functions, scatter plots, line of best fit, statistics and various higher-order thinking skills: prediction, data analysis, synthesis, evaluation.  One CSO this would cover would be: M.O.8.2.10 - identify a real life problem involving change over time; make a hypothesis as to the outcome; develop, justify, and implement a method to collect, organize, and analyze data; generalize the results to make a conclusion; compare the hypothesis and the results of the investigation; present the project using words, graphs, drawings, models, or tables.
 
Educator's View of Current Project


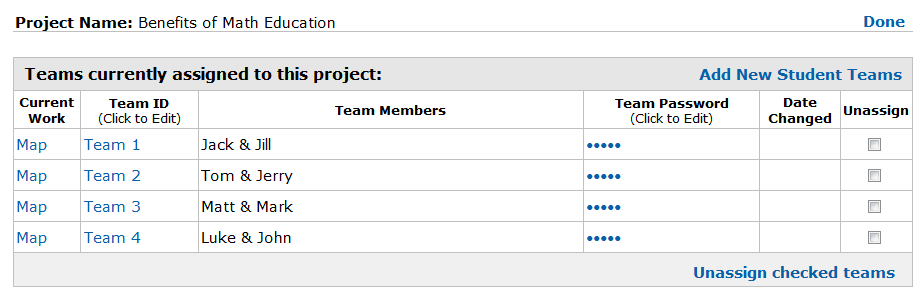
Educator's View of Teams on current project.


Educator's View of Student's Work.


Actual Mapping made ny Educator and Student's.


WHY TOOL WAS CHOSEN:
With the Seeing Reason Tool students can create visual maps of the factors and relationships in a cause-and-effect investigation. These maps make thinking visible and promote collaboration as students work together to refine their understanding.  The tool supports cycles of investigation where students gather what they know, organize that knowledge into a map, and then investigate whether their initial concepts are supported by evidence. 

The Seeing Reason Tool is useful at several points during an investigation—at the beginning when initial ideas about a problem are conceived, during research phases as knowledge and insight grow, and finally, as a presentation of students' fullest understanding of the problem. For this lesson, the student will use it to create a pre-data map of what they think and then go back and edit their map, during and at the end, to include what evidence they found through analyzing their collected data.


CK & PCK:
The Mishra & Koehler (2006) article states that, “Pedagogical content knowledge includes knowing what teaching approaches fit the content, and likewise, knowing how the elements of the content can be arranged for better teaching” (pp. 1027). PCK is concerned with the representation and formulation of concepts, pedagogical techniques, as well as knowledge of what makes concepts difficult or easy to learn, student’s prior knowledge, and theories of epistemology.

Content knowledge is knowledge about the actual subject matter that is to be learned or taught.  CK includes knowledge of concepts, theories, ideas, organizational framework, knowledge of evidence and proof, as well as established practices and approaches towards developing such knowledge (Koehler & Mishra, 2008, pp.13).

This activity intersects with content knowledge (CK) and pedagogical content knowledge (PCK).  The CK here is based on a WV CSO that states what concept and knowledge is to be taught by the teacher and learned by the students.  CK doesn’t work alone, PCK is also involved.  PCK is knowledge about how to make a subject understandable to learners, and in this activity the way that the activity is explained and arranged is for ease of use for students and was designed to help students build off their prior knowledge and use higher order thinking skills to obtain more content knowledge according to the CSO.   
 

HIGHER ORDER THINKING SKILLS:
This activity accommodates the development of student’s higher order thinking skills.  When it comes to higher order thinking skill, “an underlying idea is that some types of learning require more cognitive processing than others. Higher order thinking involves the learning of complex judgmental skills such as critical thinking and problem solving and is more difficult to learn or teach but also more valuable because such skills are more likely to be useable in everyday situations” Higher Order Thinking, 2010). The various higher-order thinking skills that can be seen within this activity are prediction, data analysis, synthesis, and evaluation.  Thinking skills can be improved by understanding the processes involved in thinking. We do not teach children to think, but we can help children to organize their thinking to facilitate more complex reasoning.

There are many ways to foster higher order thinking in the classroom such as including some of the following into the class room environment: multi-level materials, flexible grouping, accepting and celebrating diversity, print-rich environment, high expectations, teacher is seen as co-learner, and nurturing risk-taking.  Also, having students participate in the following kinds of activities: cooperative group activities in which students can communicate with others in a variety of ways, problem-solving activities that require more than routine calculations, open-ended activities with more than one "right" answer, activities which accommodate multiple intelligences, and activities in which both genders participate freely (Higher Order Thinking, 2010). 

This activity allows students work in a group setting and there are high expectations associated with this activity, also risk taking is nurtured and encouraged.  Students get to complete a problem solving activity and communicate with others in a variety of ways.  Also, since the activity is open-ended they are free to choose what they want to research within the boundaries and there is more than one “right” answer. More specifically, students will think about and talk about their learning, negotiate the meaning of their symbols and make their ideas public, translate from one form of knowledge to another, transfer their knowledge to other cause-and-effect situations, and gain experience in using tools for problem solving.
 

REFERENCES:

Higher Order Thinking - WikEd. (n.d.). WikEd. Retrieved April 23, 2012, from http://wik.ed.uiuc.edu/index.php/Higher_Order_Thinking

Koehler, M. J., & Mishra, P. (2008). Introducing Technological Pedagogical Knowledge. In AACTE (Eds.). The Handbook of Technological Pedagogical Content Knowledge for Educators. To be published by AACTE and Lawrence Erlbaum Associates.

Mishra, P., & Koehler, M. J. (2006). Technological Pedagogical Content Knowledge: A new framework for teacher knowledge. Teachers College Record. 108(6), 1017-1054.

 ISTE NETS T - Standard1 (b) &(c), Standard 2 (a), & Standard 3 (d): This assigment covers various standards as it was multi dimensional. Performing the activity designed for this assigmnet would allow students to explore real world issues and solve problems using a digital tool. In explaining and setting the tool up with them the educator would be promoting student reflection using collaborative tools and incorporating digital toosl and resources that promote student learning and creativity. Also, the educator would be modeling effective use of the tool to locate, analyze, evaulate, and use resources.
1. Facilitate and Inspire Student Learning and Creativity,
b. Engage students in exploring real-world issues and solving authentic problems using digital tools and resources c. Promote student reflection using collaborative tools to reveal and clarify students’ conceptual understanding and thinking, planning, and creative processes
2. Design and Develop Digital Age Learning Experiences and Assessments
a. Design or adapt relevant learning experiences that incorporate digital tools and resources to promote student learning and creativity
3. Model Digital Age Work and Learning
d. Model and facilitate effective use of current and emerging digital tools to locate, analyze, evaluate, and use information resources to support research and learning

Tuesday, April 10, 2012

Voice Thread

With VoiceThread, group conversations are collected and shared in one place from anywhere in the world. A VoiceThread is a collaborative, multimedia slide show that holds images, documents, and videos and allows people to navigate slides and leave comments in 5 ways - using voice (with a mic or telephone), text, audio file, or video (via a webcam). 
One cool thing about this is that you can Share a VoiceThread with friends, students, and colleagues for them to record comments also.Users can doodle while commenting, use multiple identities, and pick which comments are shown through moderation. VoiceThreads can even be embedded to show and receive comments on other websites andexported to MP3 players or DVDs to play as archival movies.

I actually downloaded a Mobile App to my iPad for VoiceThread, now I can read and listen and create from my iPad! :)


Here I left a text comment on Richard Pierce's VoiceThread about Generations and Internet.


And here is a Voice Thread that I created for a future math class.  The benefits of using Voice Thread is that it allows students some creativity and keeps them interested.  How neat is it to be able to see and hear your comments and your fellow students comments on certain topics and problems.  They can learn from each other this way.  One barrier is that some students may be shy and may not want to leave a voice comment, but they can easily leave a text comment instead.  It may be difficult to grade an assigment like this, as there will be various forms of answers, but one way is making it participation points and adding it to a test or something.  It would be a good way to review things so that students can see other students ways of working out problems and such.  I think it is really neat and would like to incorporate it into my future classroom. 


ISTE NETS T standards:  This activity relates to the standards by understanding and developing resources created and effectively used in the classroom.  I used power point to create images to be used in a voice thread that could be used to view and check student achievement.  The standards imply that teachers much "demonstrate fluency in technology systems and the transfer of current knowledge to new technologies and situations," which is clearly shown in this tool.  This is a new technology that students find interesting and captivating and I can prove my fluency and share knowledge with my students this way.

Saturday, April 7, 2012

Pecha Kucha

PechaKucha 20x20 is a simple presentation format where you show 20 images, each for 20 seconds. The images forward automatically and you talk along to the images. I created a PechaKucha about Math, since I one day hope to teach math classes.


The way I went about making this was to find pictures and put them into Microsoft Powerpoint, once I had my 20 pictures in on 20 different slides I saved in a jpeg format.  I, then, downloaded  PhotoStory and imported the 20 picture slides that I saved and created a photo story customizing my motion and timing and adding voice.  So I set it to no motion and 20 seconds per slide, then put my voice recording over each slide and saved it into yet another format, .wmv, so that I could upload the video to YouTube.


I found this assignment to be fun, even though I dont like hearing my voice recorded and played back.  I enjoyed looking for pictures and putting narrative with them and hope that using fun pictures can keep the attention of students.  I would use this again in the future and I believe it is a fun way to learn about things for students.  Students like videos and pictures and any break from the common lecture, notes, homework routine.


ISTE NETS T #2 - Design & Develop Digital-Age Learning Experiences & Assessments. (A) Design or adapt relevant learning experiences that incorporate digital tools and resources to promote student learning and creativity.

Tuesday, March 27, 2012

Self-Grading Forms

We were asked to create a form that is self grading.  I also found a blog that gives you more directions in making a self- grading form:  Self-grading multiple-choice tests with Google Docs  I found this bloggers directions to be very helpful and easy to follow.
Here is my form: Math Quiz


Here is my spreadsheet: Math Quiz Spreadsheet/Grades


How neat is it that you can create a quiz that grades itself for you?  I thought that making a survey was cool.  I used Google Docs to create a Form that was self-grading.  I made it a 5 question math quiz similar to what questions one would find on the ACT. 

Just like when I made the survey, you are able to add themes to your self-grading quiz in order to make it more visibly appealing to those who are taking it.  Help text is also an option to make it easier for your participants to answer your questions. 

Once you have a form/quiz made, you can share it with the public or if you’d rather you could share it with your choice of people.  I chose to share mine with the public.  When I clicked Share on Google Docs I made it open to the public so that you didn’t have to be a Google Docs user or logged into your Google account to fill it out.  I shared it with my Google circle, emailed it to a few students in my class, and posted the link on Facebook in order to get a good number of responses.
Here’s the cool part.  Once a student submits their responses, you can write a formula in the spreadsheet that will grade their answers for you and even give you a percentage!  See my spreadsheet (above) for grading examples.

I went above and beyond on this due to all of the excited participants who were eager to learn. You have the option of changing the message people receive after completing the quiz. Well, I made a Google Docs Presentation containing the answer and the work to get the answers, so that people can see how they did. This will be useful when I use this with my 7th & 8th grade classes that I am observing with because after they take the quiz we can go over it together as a class with a Slideshow presentation.


ISTE NETS T - Standard 1 & 2- Standard 1. During this activity, students are expected to complete an assignment using digital tools, technology system and media (Google Forms). Students are expected to be active in their own learning and understanding of the content. Digital communication aides in the advancement of resources and support. Standard 2. Design and Develop Digital-Age Learning Experiences and Assessments. This assignment was to design and develop an assessment digitally.

Monday, March 26, 2012

Google Forms

We were asked to make a Google form.   I decided to make mine about math, since that is what I got my undergrad in.  My form is about your math background.  I made it to learn more about people’s math background and past math experiences. 


Google forms is actually a pretty neat tool.  You can create online quizzes, surveys, or any type of questionnaire you want.  There are many different question types you can use that all send data straight into a useable spreadsheet.  With these answers you could even do statistical analysis testing to determine various outcomes.

You are also able to add themes to your survey/questionnaire in order to make it more visibly appealing to those who are taking it.  Help text is also an option to make it easier for your participants to answer your questions. 
Once you have a form made, you can share it with the public or if you’d rather you could share it with your choice of people.  I chose to chare mine with the public.  When I clicked Share on Google Docs I made it open to the public so that you didn’t have to be a Google Docs user or logged into your Google account to fill it out.  I shared it with my Google circle, emailed it to a few students in my class, and posted the link on Facebook in order to get a good number of people to take it. 

Forms and surveys like this could be used in professional life.  Being a teacher you could use this for qualitative and quantitative research data collecting.  There are various types of questions and all give you various outputs of data that can be manipulated and used.  You can view the form as embedded into another website or by clicking a hyperlink on a webpage or in an email.  There are various views including; the Live Form, the spreadsheet, and the summary of the results.  The form is basically a nice mask for the spreadsheet.  You could ask people to fill in their answers on a spreadsheet to use later or you could give them a visually appealing and better explained Google Form so that it is easier on them and you end up with the data organized into a spreadsheet for you.  Like I said earlier, there are many ways to share the survey.  You can publish it to public on Google, you can email it to whomever you please, you can embed it into a website, or even hyperlink it into a website.  The results can be viewed upon competition of the survey in a summary of the results or you can view them in spreadsheet format. 

 ISTE NETS T - Standard 1 & 2- Standard 1. During this activity, students are expected to complete an assignment using digital tools, technology system and media (Google Forms). Students are expected to be active in their own learning and understanding of the content. Digital communication aides in the advancement of resources and support. Standard 2. Design and Develop Digital-Age Learning Experiences and Assessments. This assignment was to design and develop an assessment/survey digitally. 

Tuesday, March 20, 2012

APA Paper

Phew. Glad that one is over and handed in. The assignment was to write up a results section, in APA format, for various influences on quiz scores. 
We were given the data in excel and had to manipulate it in order to determine if any of the following things had a significant influence on quiz scores: personality (introvert or extrovert), sex (male or female), teaching status (teaching or non-teaching), age and millennial score.

            At first I struggled with setting up the second set of data,
            that was needed to complete the second table, but it was
            because I was comparing apples to oranges. Once I got
            that straightened out, the rest of the data manipulation
            and testing went fine.

Once the t-tests were complete and the p values were found for each section a paper could be formed. We were to write a "results" section of a paper containing the data that we manipulated earlier to demonstrate our abilities in spreadsheets, word processing, and APA formatting.

            The most trying part of this assigment was formatting. Two
            different websites were given to explain APA formatting.
            One for APA formatting and one for journal formatting.
            Having both websites as explanations was confusing as they
            had conflicting advice.  I posted a discussion question on
            Blackboard: "Do we single space (journal website) or double
            space (general apa guidelines) and do we change paper size 
            and such like journals?Also, page numbers top right (general 
            apa format) or bottom center (journal format)?  Pierce 
            emailed us: double and topright, which are both basic
            APA format and not journal format.  Once I got that part
            figured out I completed my paper and submitted.

The outcomes of this assigment were to understand APA formatting for numbers, tables, style, text, t-test findings, and references.  Also, to be able to develop, test, and interpret results of a hypothesis using bivvariate analysis in spreadsheet form and to develop a narrative paper in APA style to write up the results.  I believe that I accomplished all of these otucomes and have a better understanding of all of those things (that is before my paper has been graded).  If I had to compelte this assigment again, after learning what I learned about formatting and statistical tests I believe that I could cut the amount of hours that I put into this paper at least in half if not more. 

*** I did ok on the paper, not quite qhat I expected, but not bad.  There were a couple of things that I needed to work on a little harder.  I didnt have APA quite right for discussing the tables but upon reviewing more research papers I am learning a lot more.  I do feel comfortable with organizing and manipulating data in excel and I am pretty confident in my formatting of tables APA in a sense that if I had to do this all over again I would do it much better and probably much quicker. 

ISTE NETS T - Standard 3a,b,d: Model Digital - Teachers exhibit knowledge, skills, and work processes representative of an innovative professional in a global and digital society. Teachers: a)demonstrate fluency in technology systems and transfre of current knowledge to new technologies and situations.  Ive never used t tests before this class.  I have seen p values but didnt understand what they came from, so I could apply my knowledge from statistics classes to this assignment and I will be able to apply this assigment to future assigments. b)collaborate with peers using digital tools and resources to support student success and innovation.  Me and a couple of the other students in this class collaborated over email, im, and in person.  d) Model and facilitate effective use of current and emerging digital tools to locate, analyze, evaluate, and use information resources to support research and learning.  I had to use excel to complete these t-tests and analyze the data given.

Wednesday, February 22, 2012

Excel 2

Using the same data as the previous Excel blog, we were asked to look at a research question.
Used NCES site and looked at the state comparisons to assess where we are in terms of the national educational landscape. 

Research Question: What factor, if any, does gender play in 8th grade math performance?
Hypothesis: There is a difference between the male and female scores.
Hypothesis: There is no difference. (null hypothesis)

For this particular question we will be looking at the following information:
categorical independent variable is gender male/female.
continuous dependent variable is NAEP 2011 8th Grade state math averages.


We know the averages and standard deviations from our descriptive statistics. Now we need to know whether to accept or reject the null hypothesis.  We can use a
 t-test & then Look at the 2 tail p value and make a decision.  The picture below is a Jing image of the t-test I carried out for the given data.


As you can see by the t-chart, which gives you an average as well as p values (which we needed), there isn’t a difference between male and female scores.  To break that down I highlighted the p values.  On the right side, NSD stands for no significant difference because our p value is greater than 0.05.  Either test gives the same result, even the two tail is greater than 0.05, so there is no significant difference and thus we must accept the null hypothesis.  There is no difference between the male or female scores. 

 ISTE NETS T - Standard 1 & 2- During this activity, students are expected to complete an assignment using digital tools (Jing), technology system (Excel) and media. Students are expected to be active in their own learning and understanding of the content. Digital communication aides in the advancement of resources and support. This activity is a great summative assessment due to the nature of the outcomes. The scatter plot offers some sort of data that should be relevant to the assignment.

Excel 1

Used NCES site and looked at the state comparisons to assess where we are in terms of the national educational landscape.
Sort the scores Ascending / Total Score.
Compute the descriptive statistics for the total score column.


West Virginia is fairly low when it comes to comparing National Center for Education Statistics National Assessment of Educational Progress 8th grade math scale scores to other states.  There are merely 5 states below West Virginia, leaving the remaining 57 states included in this study above West Virginia.  By looking at the scatterplot above, you can see that West Virginia isn’t close to average; we are actually below it by quite a bit. 


 ISTE NETS T - Standard 1 & 2- During this activity, students are expected to complete an assignment using digital tools (Jing), technology system (Excel) and media. Students are expected to be active in their own learning and understanding of the content. Digital communication aides in the advancement of resources and support. This activity is a great summative assessment due to the nature of the outcomes. The scatter plot offers some sort of data that should be relevant to the assignment.

Saturday, February 18, 2012

Jeopardy

For this assignment we were to create a Jeopardy game to use in our current or future classrooms.  (Hum Jeopardy theme song to yourself, in your head, as you read this.) I made a somewhat, universal one that would help review for tests like the ACT or in an Algebra or Algebra 2 class after going over a unit on solving equations. 

I got my material from the Pearson, Prentice Hall, Algebra book that was used at Morgantown High School (Morgantown West Virginia) last year for their Algebra classes. 
     The game comes from Chapter 2 – Solving Equations.  The sub categories are
1. Solving One-Step Equations,
2. Solving Two-Step Equations,
3. Solving Multi-Step Equations,
4. Solving Equations with Variables on Both Sides, and
5. Solving Word Problems by Setting up and Solving One- Step, Two-Step, Multi-Step,  
    and Variables on Both Sides Equations

Click to PLAY     --- or ---    Click to EDIT  
(I can go back to this website(with password) and edit later if I want to tweak)

My questions and answers aren’t quite in Jeopardy form where the answer is given and you have to give the question, because in math that would be a whole other game.  If I said x=5, what is the question, you could give me all kinds of questions that x=5 would be the solution to.  So, I switched it up. Problem to solve: solution & work given when clicked.  It is still played the same way, with teams, and various point levels.

I included the work written out with the answers.  Also, the categories go from 100 being easier problems of that sort to 500 being the harder problems of that sort.  The categories progressively get a little more difficult also.  I mixed in decimals, fractions, distribution, money, and commutative property.

I used html in the building of this Jeopardy game (take out *’s for the html codes to work),
·         to make certain text italicized <*em >text you want italicized here<*/em >,
·         underlined <*ins >text you want underlined here<*/ins >,
·         and even for <*b  />
line          <*b  />  
breaks,    <*b  />  (got to put those at the end of the line to break that way)
so that it looks neat & tidy.

I enjoyed this assignment.  We have been learning about “The Play Years” in EDUC 6302 – Human Growth & Development, and I believe that play is very important to incorporate into curriculum & what better way to get excited about math then playing a good ol’ game of Jeopardy!!

 ISTE NETS T - Standard 2. Design and Develop Digital-Age Learning Experiences and Assessments
After making this review game based on mathematical practice, students are engaging in a teacher designed learning experience. This review could be based on summative or formative assessments. This type of assessment can be customized for the individual students through a creative digital tool.

Jing Video

I used "Jing" to capture a video of How to Set up a Second Blog Attached to an Already Existing Blogspot Blog Account.   I choose to do something fairly simple for anyone who already has a blogspot account, but it shows that I know how to use "Jing" to create a "Jing video."  I had to have two blogs – one for this class and one for observing as a FSU Teacher Candidate.  So, I figured why not teach others in case they, too, have to have two blogs.

Unable to display content. Adobe Flash is required.

With "Jing" video you can create a digital movie without a digital camera.  By clicking on the first prong of the sun you can determine what part of your screen you would like to capture and you can choose the video option instead of the picture option.  (The other two prongs on the sun are for your "Jing" history and “More”-which is where you can find out more about "Jing" and your settings. Once you have captured the video that you were trying to capture you can either save it to your computer or you can share it to screencast.com and it will become a URL.  It can also be found later in your "Jing" history where you can save or share it again later.  The address to your screen capture, if saved, on your computer where be where ever you saved it and whatever you titled it with a “.swf” (shockwave flash object) as its file type.
 ISTE NETS T - Standard 1.  Facilitate and Inspire Student Learning and Creativity.  By using the "Jing" video feature to teach students, colleges, and/or parents how to complete a task, we are using knowledge of a subject matter to enhance and use technology. We are offering support by implementing and step-by-step process that could be used in a real world setting.

Saturday, February 11, 2012

Personality – Blog Post #2

I took the personality test  and it turns out that I must be an ENTJ just as I predicted myself to be, because this test gave me that result as well.


I was correct when guessing my personality type.  It seems as though I am slightly intuitive where I would have guessed that it would have been a bit stronger of a trait.  But, alas, ENTJ through and through.  The various descriptions said that, being an ENTJ, I am a leader and like to gain and share knowledge.  I am also a strong organizer and planner.  I could work on my introvertedness a touch in order to understand myself more and thus be more emotionally connected to others. 

I feel as though the description of an ENTJ is very closely related to what most would describe a teacher as. In a situation where I am working with a group of students, teachers, or principles, I should jump at the opportunity to communicate visions and goals of others to them.  I should also be the one to organize and coordinate when working in a group setting, as my natural instincts are ordering priorities, systematizing, generalizing, summarizing, and marshalling.

Different roles are important in different circumstances. Teams should be analyzed both in terms of what team skills are most needed, and also in relation to what team roles members can play.  The interaction between the different personalities of individuals can be a frequent source of friction, despite having well defined roles within a team. However, this can largely be avoided by understanding and valuing people’s differences. The Myers Briggs Type Indicator (MBTI) is a powerful aid to both team and personal development by providing a well-researched framework for understanding these differences.

 ISTE NETS T - Standard 2c.  Design & Develop Digital-Age Learning Experiences & Assessments.  Customize and personalize learning activities to address students' diverse learning styles, working strategies, and abilities using digital tools and resources.

Personality – Blog Post #1

I started this assignment by Reading this.  By deciding on my preference in each of the four categories I proclaim to be an ENTJ which means:
ENTJ – Extraversion, Intuition, Thinking, Judging Frank, decisive, assume leadership readily. Quickly see illogical and inefficient procedures and policies, develop and implement comprehensive systems to solve organizational problems. Enjoy long-term planning and goal setting. Usually well informed, well read. Enjoy expanding their knowledge and passing it on to others. Forceful in presenting their ideas.

I am definitely an ENTJ.  I am very decisive and frank, however, I don’t tend to assume leadership among peers – rather among students I am teaching.  I do feel that I see illogical and inefficient procedures and policies quickly and find myself developing plans and organization to correct those problems.  I love helping people organize themselves and can’t stand an unorganized office, desk, room, etc.  I am 110% a long-term planner and goal setter.  With my past running experiences and my future teaching experiences, planning and goal setting were and are very necessary.   I consider myself to be well read and informed and I do enjoy sharing what I know with others.  I love learning, whether it be me or someone else learning from me – hence the desire to be a teacher.  The description of an ENTJ basically fits me perfectly.

The other website, Keirsey.com, labeled me as a Field Marshal:
Hardly more than two percent of the total population, Fieldmarshals are bound to lead others, and from an early age they can be observed taking command of groups. In some cases, they simply find themselves in charge of groups, and are mystified as to how this happened. But the reason is that they have a strong natural urge to give structure and direction wherever they are - to harness people in the field and to direct them to achieve distant goals. They resemble Supervisors in their tendency to establish plans for a task, enterprise, or organization, but Fieldmarshals search more for policy and goals than for regulations and procedures.
They cannot not build organizations, and cannot not push to implement their goals. When in charge of an organization, whether in the military, business, education, or government, Fieldmarshals more than any other type desire (and generally have the ability) to visualize where the organization is going, and they seem able to communicate that vision to others. Their organizational and coordinating skills tends to be highly developed, which means that they are likely to be good at systematizing, ordering priorities, generalizing, summarizing, marshaling evidence, and at demonstrating their ideas. Their ability to organize, however, may be more highly developed than their ability to analyze.

Again, I feel that this label is describing me to a T.  Thus, I deem myself an ENTJ - Field Marshal, wonder what taking a personality test would tell me?

Friday, February 10, 2012

Jing Image


I began this assignment by downloading and installing Jing & then watching a video explaining how Jing works.

I then created a graphic that I believe I could use in my teaching:


This graphic could be used when teaching synthetic division to Algebra 2 students in high school.  It shows two ways to find the same thing.  It could be introduced, discusses, then left up on a “smart board” as an example as students work on similar problems.

Jing is a pretty neat program that can do a lot of things.  Using Jing I can create visual instructional materials that combine text, graphics, and images.  Jing outputs “.png” type files that you can save to any folder on your computer by clicking the save button after you have completed working on your capture.  You can access your Jing history by clicking the history button on the sun, right next to the capture button.  If you screen cast an item in your history, then it shows up as a new item in your history and will create a screen cast link.   To import Jing objects into a blogger post, you simply have to paste the link that Jing automatically put on your clipboard or you can import an image and select it from a saved file on your computer.  You publish your artifact by clicking share and a link is created on screencast.com.  You can share your artifact by creating that link by clicking share and then pasting it wherever you need.

 ISTE NETS T - Standard 3c. Model Digital-Age Work & Learning. Communicate relevant information and ideas effectively to students, parents, and peers using a variety of digital-age media and formats.